3D Printing Tactile Graphics on Paper with Rust
TL;DR I helped write a short paper on making tactile graphics, raised-line drawings for blind readers, by 3D printing a thin layer of plastic directly onto paper. The paper works out which printers, filaments, paper substrates, and slicer settings actually stick and stay legible, checks the results with blind touch readers, and introduces a browser-based tool I wrote in Rust that turns an image into a printable STL file. This post is about how the project came about and how the software works. Try it here.
When I was living in Austin I spent my Tuesday nights at the home of the late Jerry Chamkis, who had been hosting a hack night there every week for over 20 years. Jerry went blind in his old age, and being a lifelong teacher and nerd, he started teaching technology at the Texas School for the Blind and Visually Impaired (TSBVI). So we often ended up hacking on accessibility-adjacent projects: repairing braillers, playing with field recorders, etc. This project came out of one of those hack nights.
Tactile graphics
Tactile graphics are raised-line drawings used to communicate visual concepts to blind people: a map, a sine wave, a diagram of a cell. In a classroom they're how a blind student gets the picture that everyone else is looking at.
The traditional ways to make them are all expensive. Swell paper (microcapsule paper that puffs up where it's been printed black) runs about $1.50 a sheet and needs a $1,500 heating machine. Braille embossers start at around $4,000, and the ones that can do fine graphics cost more like $10,000. Thermoforming needs a hand-made physical master. On top of the cost, tactile graphics are typically made by specialists. So in practice a teacher can't just print off a tactile graphic for tomorrow's lesson the way they'd print a worksheet.
But 3D printers are cheap, and getting cheaper, and a lot of schools already have one. If a teacher could make tactile graphics with a 3D printer and some paper, that would be an improvement.
Printing on paper
The paper's idea is to clip a sheet of paper to the bed of an ordinary FDM 3D printer and print a single layer of filament directly onto it. No base plate, no support, just the lines.
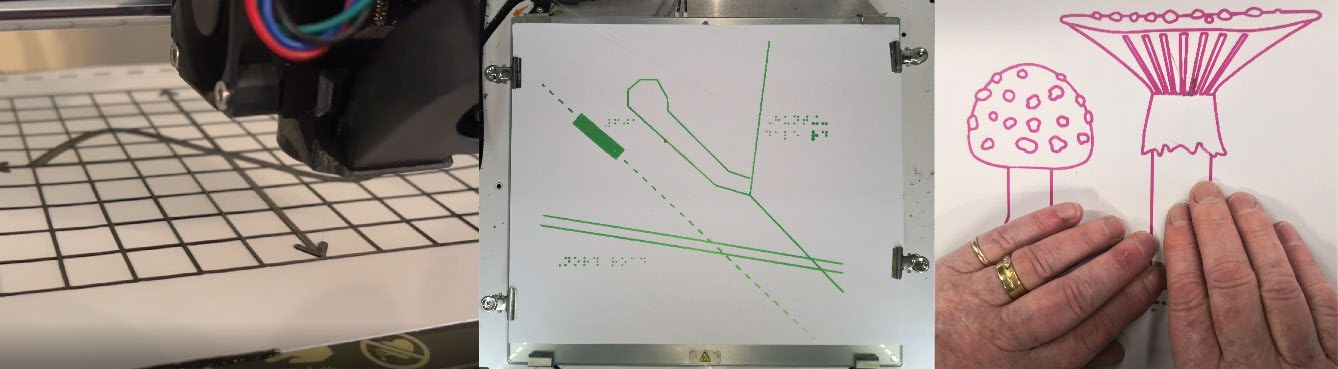
The result is a raised-line drawing on a sheet of paper. It costs a few cents in filament and takes under ten minutes. It flexes, survives repeated touch reading, and stacks in a binder like any other worksheet.
This isn't a new idea. The paper cites earlier attempts, most of which ran into the same two problems: getting the plastic to stick to the page, and the pain of converting an image into something the printer can print. So the project had two tracks. One was trial and error with filaments, papers, and slicer settings (z-offset, first layer speed, retraction tuning, and so on); the results are in the paper's appendix and in the tactile-graphics guides. The other was software to get from an image to an STL file with as few steps as possible. That was my role.
The code
The tool is a static web page, so anyone with a browser can use it without installing anything. To use it you upload an image, pick a threshold value to turn it black and white, and it extrudes that into an STL. Everything runs locally in the browser, in WebAssembly, so nothing is ever uploaded, which avoids a slew of privacy and security concerns.
The pipeline for converting images is roughly:
- Threshold. Convert to a greyscale raster image and split at a user-chosen value. Black pixels are "ink".
- Trace edges. Walk the image in 2×2 pixel windows and emit line segments where ink meets not-ink. This is a simple marching squares algorithm.
- Stitch edges. Collect those line segments into closed loops. Segments are joined end to end as they arrive, collapsing redundant collinear vertices along the way, and a loop is done when its head meets its tail. Every edge eventually closes into a loop.
- Sort holes. A loop is either an external or internal boundary. The loops get inserted into a tree using point-in-polygon tests so each outer boundary knows which holes belong to it.
- Triangulate. Each boundary-plus-holes polygon is fed to an earcut algorithm. This fills polygon with triangles. An STL file format is just a bunch of triangles.
- Ribbons Every loop also becomes a vertical ribbon of triangles between z=0 and the choosen height, with the winding flipped for holes so the normals point outward. The print height is chosen by the user, in the same units as the image's pixels. In the final STL this unit is 0.05 mm, which means a height of 15 is 0.75 mm in a typical slicer. This is like a 3D extrusion of the polygons.
- View and save. The STL is displayed, and the user can save it to a file.
None of these steps are novel, but there were no suitable off-the-shelf image-to-STL converters that ran client side and got the small features right. Braille dots at a 0.4 mm nozzle are tiny, and if the tracer smears them together or the triangulation drops a hole, the output is illegible. Most of the effort went into getting the edge stitching and hole assignment to be robust on real scans rather than clean test images.
The frontend is Yew, built with Trunk, with a three.js viewer to show the STL before download. This was one of my first Rust-on-the-web projects, and it went surprisingly smoothly. The geometry code was actually fun to write; it's just ordinary Rust with tests that run natively, and the same code compiles to Wasm without changes. The frontend framework was more of a challenge, and I think it shows in how austere the UI is.
Here is real output from the tool: a graph, thresholded and extruded. I increased the extrusion for dramatic effect. Drag to rotate, scroll to zoom.
This 3D viewer needs JavaScript. Download the STL instead.
Did it work?
My friends and collaborators took the output to five blind touch readers, ages 29 to 69, who evaluated diagrams printed with PLA, TPU, and nylon on copy paper, cardstock, and transparency sheets. All five agreed the prints were legible by touch, and all five thought the technique was useful. They didn't agree on a favorite filament, and every paper substrate was acceptable, including plain 80 gsm copy paper.
What they were most excited about was the idea that a teacher could make one on mainstream equipment, and that they might buy a cheap printer themselves to print maps of places they wanted to go.
"I'd like to be able to do it at home. Get me a map of such-and-such."
Where it stands
The paper is a preliminary investigation and the user study is small. Braille had to be scaled up about 50% from the standard to print cleanly at a 0.4 mm nozzle, which hurts legibility, so finer nozzles are worth exploring. The appendix has the full slicer settings, filament notes, and substrate notes if you want to try it.
There is a lot to improve on the software side: complex images can be slow, the user interface could be better, and it doesn't support SVG input. Source images are often vector graphics to begin with, and rasterizing them only to re-trace them is silly.
The code is on GitHub. If you're interested in improving this project, feel free to email me or send a pull request.